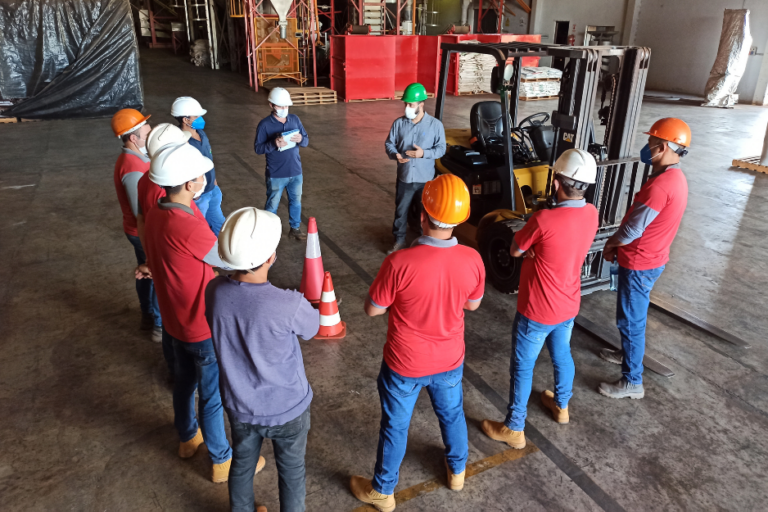
Disengaged Floor Workers Are More Likely to Have a Safety Incident
Quick answer: Yes. Employee engagement and safety incidents are measurably related, and the relationship holds across industries and countries. In Gallup’s Q12 meta-analysis of 183,806 business and work units, teams in the top quartile of engagement recorded a median of 63 percent fewer safety incidents than teams in the bottom quartile. For a plant, the practical takeaway is not that engagement is worth caring about. It is that engagement data, collected at the shift and line level, behaves like a leading indicator for a safety record your OSHA log only reports after someone is already hurt.
Most plant leaders already believe some version of this. The operator who has stopped caring is the one who skips the lockout step, walks past the puddle, and does not flag the guard that has been rattling for a week. What has been missing is not the intuition. It is the measurement.
Safety programs are rich in lagging indicators. Total recordable incident rate, DART rate, workers’ compensation claims, days away. Every one of those numbers tells you what already happened. Engagement data, measured frequently and segmented to the unit where work actually occurs, is one of the few workforce signals that moves before the incident does.
The timing matters. The 2026 Employee Engagement Report, drawing on feedback from more than 94,000 employees, found engagement recovered to 59 percent in 2025 after falling to a post-pandemic low. That sounds like good news until you read the second finding: voluntary turnover is declining while motivation and connection scores stay soft. People are staying in jobs they have checked out of. Retention, in other words, is no longer a reliable signal that a workforce is engaged.
For a plant, that is the worst available combination. The disengaged operator who quits is a staffing problem. The disengaged operator who stays is standing at the press tomorrow morning, and a falling turnover rate will tell you everything is fine.
Does employee engagement affect safety incidents in manufacturing?
The strongest evidence comes from Gallup’s Q12 meta-analysis, 11th edition, published in 2024. It pooled 736 studies across 347 organizations in 53 industries and 90 countries, covering 183,806 business and work units and 3,354,784 employees. Safety data specifically came from 62 organizations covering 12,984 work units, using measures manufacturers already track: lost workday and lost time incident rates, percentage of workdays lost to incidents, workers’ compensation claims and costs, and raw incident counts.
Two findings matter for a plant audience.
- The gap is large. Comparing top-quartile to bottom-quartile work units, the median difference in safety incidents was 63 percent. The same comparison showed 78 percent lower absenteeism and 32 percent fewer quality defects, which is the same disengagement showing up on the throughput side of the plant.
- The pattern generalizes. Gallup reports high generalizability for the safety relationship, meaning the correlation held consistently across different organizations rather than being driven by one large outlier client. Manufacturing was well represented in the underlying data, with 60 manufacturing organizations and 29,706 work units.
An honest caveat, and why including it helps you. Gallup is explicit that the meta-analysis does not directly address causality. Engagement and safety are related, and other Gallup research suggests engagement is the stronger predictor in the pair, but a 63 percent figure is a correlation between quartiles, not a promise that a survey program cuts your recordables by 63 percent. Say that out loud in a safety committee meeting. It is the difference between a claim your EHS director trusts and one they discount.
A second body of research explains the mechanism rather than the size. A meta-analysis of 203 independent samples covering 186,440 workers, published in the Journal of Applied Psychology by Nahrgang, Morgeson and Hofmann, found two distinct pathways connecting the work environment to safety outcomes. Job demands such as physical risks, hazards and task complexity drive burnout, and burnout is negatively related to working safely. Job resources such as safety knowledge, autonomy and a supportive environment drive engagement, and engagement is positively related to working safely. Across industries, exposure to risks and hazards was the most consistent demand, and a supportive environment was the most consistent resource.
That is the whole argument in one sentence: the same conditions that produce a disengaged operator also produce an unsafe one, because they are the same conditions.

Why disengaged plant workers have more safety incidents
Disengagement does not cause incidents in one dramatic way. It erodes four specific behaviors that keep a floor safe.
1. Vigilance drops before compliance does
A disengaged operator usually still follows the written procedure. What goes first is the attention between the steps. Safety on a production floor depends heavily on noticing: the pitch change in a motor, the pallet stacked half a foot too high, the coworker reaching where they should not. That noticing is effortful, and effort is exactly what disengagement withdraws. This is the burnout pathway in the Nahrgang meta-analysis, and it is invisible on a compliance audit.
2. Discretionary safety behavior stops
Safety researchers distinguish compliance, meaning doing what the rule requires, from participation, meaning the voluntary work of reporting near misses, flagging hazards, coaching a new hire and stopping a job. Participation is discretionary, and discretionary effort is the definition of engagement. When it stops, your near-miss reporting volume falls, and a falling near-miss count gets misread as improving safety when it is often the opposite.
3. People stop saying anything because nothing happened last time
The fastest route to disengagement on a floor is being asked for input and watching nothing come of it. Once that lesson lands, workers stop raising the small things, and small things are where incidents start. Group-level safety climate research in manufacturing, including work by Dov Zohar on the effect of group climate on microaccidents in manufacturing jobs, points to the supervisor and the crew as the level where this dynamic lives. Two departments in the same plant, under the same corporate safety policy, can have very different climates because they have different supervisors.
The 2026 Employee Engagement Report points at the same level. Among the workforce trends it identifies heading into 2026, rising manager burnout sits near the top. That matters more than it first appears, because two of the report’s three consistent engagement drivers, communication and employee voice and leadership effectiveness, are things a frontline supervisor delivers in person or does not deliver at all. A burned-out supervisor rarely stops enforcing rules. They stop having the second conversation, the unscheduled one where an operator mentions the guard that has been rattling.
The same report notes those three drivers have held steady across multiple years, which suggests engagement responds to sustained practice rather than to campaigns. That is an uncomfortable finding for a plant that runs a safety stand-down once a quarter and expects it to hold.
4. Disengagement leaves, and the replacement is the one who gets hurt
Turnover is engagement’s most visible consequence, and turnover is a safety exposure of its own. New and short-tenure workers carry elevated injury risk while they learn the equipment, the pace and the informal hazards nobody wrote down. A department with chronically low engagement runs a permanently higher share of green operators, which raises the incident rate independently of anything the current crew does. The exposure sits exactly where the risk is: production and general labor roles commonly run 30 to 38 percent annual turnover against 12 to 18 percent for skilled trades, so the crews with the most hands on moving equipment are also the crews with the highest churn. It also carries a replacement bill most plants underestimate, which is worth reading alongside what skilled trades turnover actually costs a plant.
Turnover is also where the cheapest safety intelligence in the building sits, and most plants throw it away. A departing operator has nothing left to protect. That makes the exit conversation the single moment you can find out whether someone left because of a guard that was never fixed, a supervisor who made stop-work calls costly, or a mandatory overtime pattern that made the job unsafe to do properly. Very few manufacturers ever learn any of it, because the standard exit process is a survey link emailed to a worker who lost company email access on their last shift. The people whose feedback would tell you the most about your floor are precisely the ones a self-serve digital survey cannot reach.
The exposure is bigger in manufacturing than in most sectors
Manufacturing carries more risk than private industry as a whole. In the U.S. Bureau of Labor Statistics Survey of Occupational Injuries and Illnesses for 2024, manufacturing recorded 2.7 total recordable cases per 100 full-time equivalent workers against 2.3 for private industry overall. The DART rate, covering cases with days away, job restriction or transfer, was 1.7 in manufacturing against 1.4 across private industry. Food manufacturing ran higher still at 3.3.
The cost side scales accordingly. The National Safety Council put the total cost of work injuries in the United States at 181.4 billion dollars in 2024, with a cost of roughly 48,000 dollars per medically consulted injury and 1.54 million dollars per death. Those are estimates of cost to society rather than a single employer’s claim cost, so use them for scale rather than for your workers’ compensation model.
Run it on your own plant. A 1,200-person facility at the manufacturing average of 2.7 recordables per 100 FTE is looking at roughly 32 recordable cases a year. You do not need a 63 percent improvement for the arithmetic to work. You need to know which of your departments sit in the bottom quartile, and that is a measurement question, not a safety-training question. The same logic applies on the turnover side, where you can calculate the true cost of turnover in manufacturing for your own headcount and wage base.

How to measure engagement as a leading safety indicator
Before the mechanics, it helps to be clear about what each number in a safety program can and cannot tell you. Most plants are rich in indicators that report the past and thin on indicators that describe the present.
Indicator | Type | What it tells you | When you learn it |
Recordable incident rate | Lagging | How many injuries already happened | After the injury |
DART rate | Lagging | How severe those injuries were | After the injury |
Workers’ compensation claims | Lagging | What the injuries cost | Weeks to months later |
Audit and inspection findings | Leading, narrow | Whether conditions meet the standard on the day you looked | On the audit schedule |
Near-miss reports | Leading, fragile | Hazards caught before harm | Only while people still bother to report |
Engagement score by crew | Leading | Whether the crew is still paying attention and still speaking up | Within weeks, if you pulse |
Exit interview themes | Leading for the unit | Why people left, including hazards nobody escalated | At every departure |
The two rows at the bottom are the ones most manufacturers are not using. They are also the only two that describe the condition of the workforce right now rather than the consequences of a condition that existed months ago.
Most manufacturers already run an annual engagement survey. Very few can use it for safety, for four fixable reasons.
Segment to the unit where safety actually happens
A company-level engagement score is useless for safety work. The Gallup research is built on business and work unit level data precisely because that is where the variance lives, and the same is true inside your plant. You need scores that break to shift, line, department and supervisor, with enough responses in each cut to be reportable. If your survey platform can only give you a plant-level number, it cannot tell you which crew to look at on Monday.
Match the cadence to the risk cycle, not the HR calendar
An annual survey produces a leading indicator that is up to twelve months stale. A staffing change, a new line, a mandatory overtime stretch or a supervisor departure can move a crew from engaged to checked out in six weeks. Quarterly pulses, plus onboarding and exit checkpoints, give you a signal that moves on the same timescale as your risk. This is the cadence question at the center of manufacturing workforce management surveys.
Measure the themes that actually track to safety
Not every engagement item predicts safety behavior. The ones that consistently do are the ones the job demands and resources research points to. Whether people have the equipment and materials to do the work correctly. Whether raising a concern leads to anything visible. Whether the immediate supervisor is seen as caring about the crew. Whether staffing and pace are sustainable. Whether people trust that stopping a job will be backed rather than punished. Track those as a named subindex and trend it against your EHS data.
Two of the three engagement drivers identified in the 2026 Employee Engagement Report, communication and employee voice and leadership effectiveness, sit directly on top of that list. That is convenient rather than coincidental. The conditions that make people engaged and the conditions that make people safe are largely the same conditions, which is why one can serve as an early reading on the other.
Join the engagement data to the safety data
This is the step almost everyone skips. Engagement scores live in HR and incident data lives in EHS, and they are keyed on different unit identifiers, so nobody ever puts them in the same table. Getting them joined on a common department or cost-center code lets you do the only analysis that matters: sort your units by engagement score, then look at the recordable rate, near-miss reporting rate and workers’ compensation claim volume for the same units, over the same period. Once you can see that relationship inside your own plant, you no longer need Gallup’s number. You have your own.
Actually reach the people on the floor
None of this works if the survey only reaches people with a corporate email address. Reaching frontline and deskless workers takes SMS, QR codes at the time clock, kiosk stations and paper fallback, in the languages spoken on the floor, with a credible confidentiality guarantee. A 30 percent response rate from a plant floor is not an engagement finding. It is a sampling problem that will quietly bias every conclusion you draw.
A measurement model you can put in front of an EHS director
- Establish a baseline. Run a full-census engagement survey with results segmented to department, shift and supervisor, and set a minimum response threshold for each reportable unit.
- Build the safety subindex. Pull the four to six items most tied to safety behavior into a named index so you have one number per unit to trend.
- Join it to EHS data. Match engagement units to incident data on a common code, then correlate the subindex against recordable rate, DART rate, near-miss reports and claim counts over the same window.
- Rank and triage. Sort units by engagement quartile. Bottom-quartile units with a rising incident rate get attention first, and the intervention is usually about the supervisor and the crew rather than a plant-wide policy change.
- Pulse quarterly. Watch the subindex for movement in high-risk units and treat a downward move as a leading indicator worth investigating before the incident.
- Capture every exit. Route departures through a structured exit interview, or third-party exit interview services, and code the responses for safety-related reasons: hazards, staffing, pace, supervisor conduct. Read those against the same unit map. In a bottom-quartile department, exit feedback frequently explains the incident rate better than the engagement survey does.
- Close the loop visibly. Report back to the floor what changed as a result. This is not a courtesy. It is what keeps the next survey from being ignored, and it is the single most common failure point in frontline engagement programs.

Turning this into a measurement program
The gap between the research and a working program is almost never conviction. Plant leaders already believe the disengaged operator is the exposed one. The gap is infrastructure: survey results that only break to the plant level, an annual cadence set by the HR calendar, a tool that reaches the office and not the floor, and engagement data that lives in a system nobody has ever joined to the incident log. Each of those is a solvable problem, and solving them is what turns a compelling statistic into a number your EHS director can act on Monday morning.
See which crews are at risk before the incident report tells you.
People Element is built for exactly the measurement problem described above. For manufacturers running mid-market and enterprise workforces, that means:
- Results that break to the crew level. Engagement scores by shift, line, department and supervisor, so you can rank units by risk instead of reading one plant-wide number that tells you nothing about where to go.
- Reach for people who do not have a desk. SMS, QR codes at the time clock, kiosk and paper options, in the languages spoken on your floor, so a plant floor response rate is a real sample rather than a sampling problem.
- Unlimited surveys. Quarterly pulsing becomes a cadence decision instead of a budget decision, which is the single biggest reason most manufacturers are still stuck on an annual survey.
- AI that flags the units worth looking at. Risk Insight surfaces groups trending toward disengagement, and Comment Analysis reads open-text responses at volume, which is where hazard mentions and near-miss language actually show up.
- Exit interviews that actually connect. Exit Interview Calling puts an in-house, U.S.-based interview team on the phone with departing employees, with at least eight outreach attempts per departure. That runs 20 to 30 percentage points above the 18 to 22 percent response rates typical of email-based exit tools among frontline employees, and produces 30 to 60 percent more candor than a manager-led conversation. For a plant, that is the difference between guessing why a department bleeds people and knowing.
- Frontline benchmarks. Manufacturing and frontline comparison data, so you know whether a department’s score is genuinely bad or simply normal for the work.
If you want to learn more, reach out to us to see how it all works.
Frequently Asked Questions
Does employee engagement affect safety incidents in manufacturing?
Yes. Gallup’s Q12 meta-analysis, 11th edition, covering 183,806 work units, found a median 63 percent difference in safety incidents between top-quartile and bottom-quartile engagement units, and reported high generalizability for that relationship across organizations. The research establishes a strong and consistent correlation rather than proven causation, and Gallup is explicit on that point.
Why do disengaged plant workers have more safety incidents?
Four mechanisms. Vigilance drops before rule compliance does, so hazards go unnoticed. Discretionary safety behavior such as near-miss reporting and hazard flagging stops. Workers who have seen concerns go nowhere stop raising them. And disengagement drives turnover, which raises the share of short-tenure workers who carry elevated injury risk.
How much fewer safety incidents do engaged teams have?
The median difference between top-quartile and bottom-quartile engagement work units was 63 percent in Gallup’s 2024 meta-analysis. Earlier editions of the same study reported 48 percent in 2012 and 70 percent in 2016, so treat the figure as a large and durable effect rather than a fixed constant.
Can engagement scores predict safety incidents at a specific plant?
Not out of the box. Published research tells you the relationship exists at scale. To use it operationally you have to join your own engagement data to your own EHS data at the department or shift level and test the correlation inside your facility. Most manufacturers have both datasets and have never put them in the same table.
How often should manufacturers survey frontline workers?
An annual census survey for the baseline, plus quarterly pulses for high-risk units, plus onboarding and exit checkpoints. Annual-only cadence produces a leading indicator that can be up to twelve months out of date, which is slower than the conditions that actually change on a plant floor.
What engagement metrics correlate most with safety performance?
Items covering equipment and materials adequacy, whether raising concerns produces action, supervisor support, sustainable staffing and pace, and confidence that stopping a job will be backed. These map to the job resources shown in the safety meta-analytic literature to drive engagement and safe working.
Do exit interviews help with plant safety?
More than most manufacturers expect. A departing worker has nothing left to protect, which makes the exit conversation the most candid safety feedback a plant will ever receive. Coding exit responses for hazard, staffing, pace and supervisor-related reasons, then reading them against the same department map used for engagement scores, often explains a unit’s incident rate better than the engagement survey alone. The constraint is participation. Email-based exit surveys miss frontline workers who lose company email access on their last shift, which is why phone-based outreach matters more in manufacturing than in office settings. See the best exit interview tools for a comparison of the formats.
Is employee engagement improving or getting worse?
Both, depending on which number you read. The 2026 Employee Engagement Report, based on more than 94,000 employees, found engagement recovered to 59 percent in 2025 after a post-pandemic low. The recovery is fragile, and the report identifies rising manager burnout as a leading 2026 trend. It also finds voluntary turnover declining while motivation and connection stay soft, meaning disengaged employees are staying rather than leaving. For a safety program, a headline recovery is not reassurance: the operator who has checked out but not quit is still on the floor.
Sources
- Harter, J. K., Tatel, C. E., Agrawal, S., Blue, A., Plowman, S. K., Asplund, J., Yu, S., & Kemp, A. (2024). The Relationship Between Engagement at Work and Organizational Outcomes: Q12 Meta-Analysis, 11th Edition. Gallup, Inc. gallup.com/workplace/321725/gallup-q12-meta-analysis-report.aspx
- People Element. (2026). 2026 Employee Engagement Report. Based on feedback from more than 94,000 employees. get.peopleelement.com/2026-employee-engagement-report
- Nahrgang, J. D., Morgeson, F. P., & Hofmann, D. A. (2011). Safety at work: A meta-analytic investigation of the link between job demands, job resources, burnout, engagement, and safety outcomes. Journal of Applied Psychology, 96(1), 71 to 94.
- Zohar, D. (2000). A group-level model of safety climate: Testing the effect of group climate on microaccidents in manufacturing jobs. Journal of Applied Psychology, 85(4).
- S. Bureau of Labor Statistics. (2026). Survey of Occupational Injuries and Illnesses, Table 1: Incidence rates of nonfatal occupational injuries and illnesses by industry and case types, 2024. Released January 22, 2026.
- S. Bureau of Labor Statistics. Job Openings and Labor Turnover Survey (JOLTS), 2025 annual data. Manufacturing separations averaged 2.4 percent monthly, roughly 29 percent annualized.
- Manufacturers Alliance. (2024). Workforce Trends Survey. 192 companies; 26.3 percent average total turnover.
- National Safety Council. Injury Facts: Work Injury Costs, 2024 data. injuryfacts.nsc.org/work/costs/work-injury-costs/